

Image Details
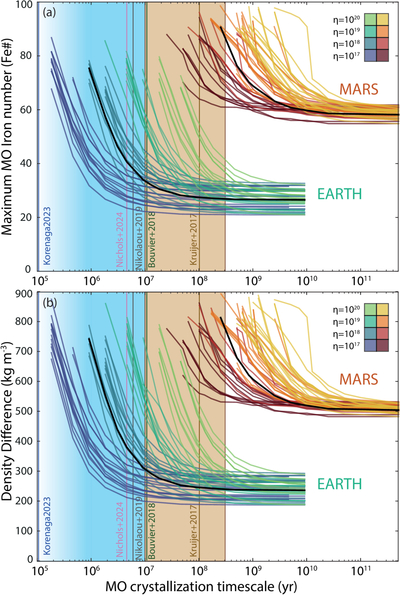
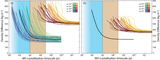
Caption: Figure 2.
Earth and Mars cases showing different crystallization timescales as lines. Black lines are reference (average) cases with η = 1018, Fe# = 10 and 20, and core temperatures of 4400 and 2400 K (respectively for Earth and Mars). For the properties we explore and associated references, see text. (a) Maximum Fe# for a given crystallization timescale. (b) Resulting density difference of the buffered layer as a function of the crystallization timescale.
Other Images in This Article
Copyright and Terms & Conditions
© 2026. The Author(s). Published by the American Astronomical Society.

Copyright ©
2026 Astronomy Image Explorer. All Rights Reserved.
