Image Details
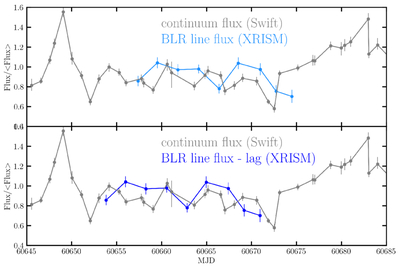
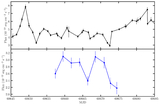
Caption: Figure 6.
Continuum and BLR line flux trends, relative to local mean values. The XRISM data are vertically shifted to better enable comparisons with local trends in the continuum flux. When shifted by the best-fit lag, the BLR line flux more closely matches the continuum flux trend.
Other Images in This Article
Copyright and Terms & Conditions
© 2026. The Author(s). Published by the American Astronomical Society.
Copyright ©
2026 Astronomy Image Explorer. All Rights Reserved.