Image Details
Caption: Figure 1.
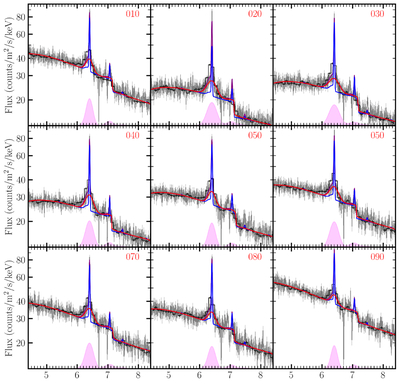
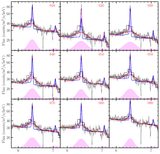
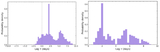
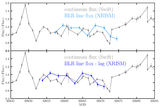
The nine XRISM spectra of NGC 4151, centered on the narrow Fe K − α emission line. The data are binned for visual clarity. The Resolve spectrum is shown in gray, and the Xtend spectrum is shown in black. For clarity, only the Resolve model components are shown (purple: total model, blue: torus line, red: BLR line). The shaded magenta region depicts the flux of the BLR line without the continuum. Note that the BLR line varies in peak strength and width, and the total line flux depends on both parameters.
Other Images in This Article
Copyright and Terms & Conditions
© 2026. The Author(s). Published by the American Astronomical Society.
Copyright ©
2026 Astronomy Image Explorer. All Rights Reserved.