Image Details
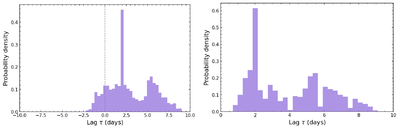
Caption: Figure 5.
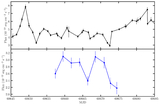
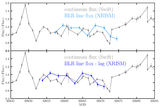
The cross-correlation centroid lag probability distributions that result from running pyCCF with 10,000 Monte Carlo simulations over a range of [-5,10] days (left) and [0,10] days (right). The distribution shown at left verifies that there are no spurious peaks below zero lag. The distribution at right indicates that the BLR component of the Fe Kα line lags the driving continuum by ﹩\tau =3.{5}_{-1.7}^{+2.8}﹩ days. Fully consistent results are obtained by running Javelin instead of pyCCF.
Other Images in This Article
Copyright and Terms & Conditions
© 2026. The Author(s). Published by the American Astronomical Society.
Copyright ©
2026 Astronomy Image Explorer. All Rights Reserved.