

Image Details
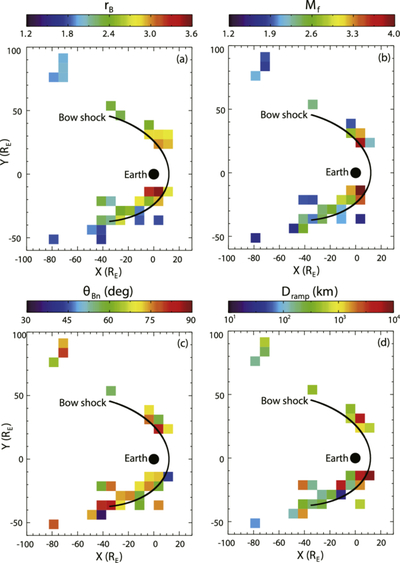
Caption: Figure A1.
Spatial distribution of bow-shock crossings projected onto the GSE x–y-plane, color-coded by the median values of the corresponding shock parameters: magnetic compression ratio rB (a), fast magnetosonic Mach number Mf (b), the angle between the upstream magnetic field and shock’s normal θBn (c), and shock ramp thickness Dramp (d). The color scale for each parameter is indicated by the color bar in each panel. The solid black circle marks the position of Earth, and the solid black curve represents the predicted location of the Earth’s bow shock (M. Jerab et al. 2005).
Other Images in This Article
Copyright and Terms & Conditions
© 2026. The Author(s). Published by the American Astronomical Society.

Copyright ©
2026 Astronomy Image Explorer. All Rights Reserved.
