

Image Details
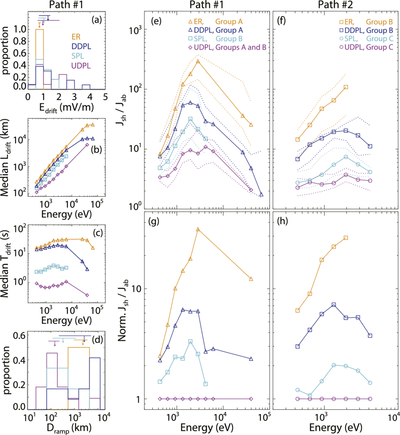
Caption: Figure 3.
(a) Histograms of Edrift for UDPL (pink), SPL (light blue), DDPL (dark blue), and ER (orange) types in Path #1. (b)–(c) Median electron drift length Ldrift (b) and drift time Tdrift (c) versus downstream electron energy. (d) Histogram of Dramp. (e)–(f) Median Jsh/Jab versus energy, with dashed lines indicating the interquartile range. (g)–(h) Median Jsh/Jab versus energy, normalized by the median Jsh/Jab of the UDPL type.
Other Images in This Article
Copyright and Terms & Conditions
© 2026. The Author(s). Published by the American Astronomical Society.

Copyright ©
2026 Astronomy Image Explorer. All Rights Reserved.
