

Image Details
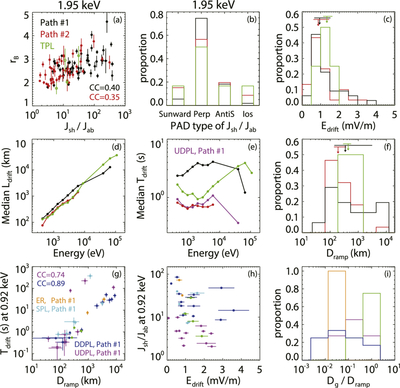
Caption: Figure 4.
(a) Scatter plot of Jsh/Jab versus rB for spectral types in path #1 (black), path #2 (red), and the TPL (green) type. (b) Proportion of events with Jsh/Jab peaking in the sunward, perpendicular, and antisunward direction, as well as events with roughly isotropic Jsh/Jab. (c) Histograms of Edrift. (d)–(e) Median electron drift length Ldrift (d) and drift time Tdrift (e) versus downstream electron energy. (f) Histograms of Dramp. (g) Scatter plot of Dramp versus Tdrift for spectral types in path #1 and the TPL type. (h) Scatter plot of Edrift versus Jsh/Jab. (i) Histograms of Dg/Dramp, where Dg is the electron gyrodiameter at the spectral break energy. For the TPL type, the higher break energy ε2 is used. In (e) and (g)–(h), pink, light blue, dark blue, and orange indicate UDPL, SPL, DDPL, and ER types in path #1, respectively.
Other Images in This Article
Copyright and Terms & Conditions
© 2026. The Author(s). Published by the American Astronomical Society.

