

Image Details
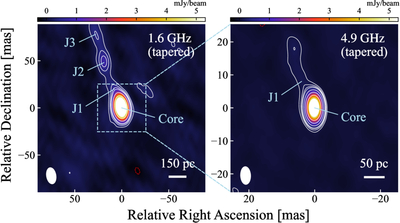
Caption: Figure 5.
The uv-tapered VLBA images of ID830 at 1.6 GHz (left) and 4.9 GHz (right). The negative and positive contours are shown as the red dashed and solid white lines, respectively. The contour levels are at −1, 1, 2, 3, 4, 8, ..., 2n times the 3σ rms noise level. The white ellipse in each panel represents the beam size. The core and jet components (J1–J3) are also labeled in the figure. We adopt a different color scale from that used in Figure 1 to better highlight the jet emission.
Other Images in This Article
Copyright and Terms & Conditions
© 2026. The Author(s). Published by the American Astronomical Society.

Copyright ©
2026 Astronomy Image Explorer. All Rights Reserved.
