

Image Details
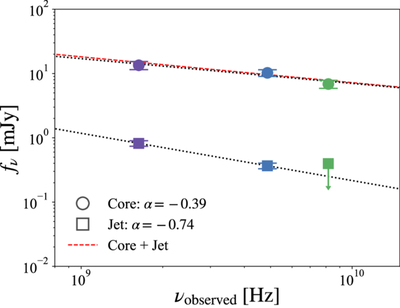
Caption: Figure 2.
The observed-frame radio SED of ID830. The circles and squares indicate the flux densities of the core and jet (J1) components at 1.6 GHz (purple), 4.9 GHz (blue), and 8.2 GHz (green), respectively. The black dotted lines represent the best-fit spectral slopes of the core and jet components, respectively. The red dashed line represents the best-fit slope of the total (core+jet) component.
Other Images in This Article
Copyright and Terms & Conditions
© 2026. The Author(s). Published by the American Astronomical Society.

Copyright ©
2026 Astronomy Image Explorer. All Rights Reserved.
