

Image Details
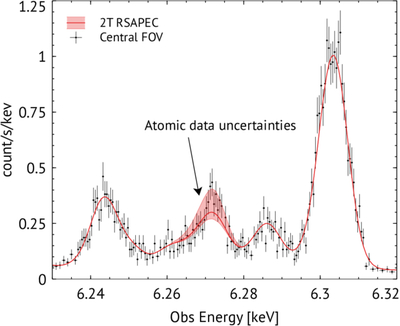
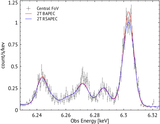
Caption: Figure 8.
Resolve spectrum extracted from the central FOV (black data), as shown in Figure 1, fitted with a two-temperature CIE model (red curve) accounting for resonant scattering of optically thick lines. The shaded region shows the variation of Fe xxv-Heα y-line emissivity due to atomic data uncertainties in the transition probability and collision strength.
Other Images in This Article

Copyright and Terms & Conditions
© 2026. The Author(s). Published by the American Astronomical Society.

Copyright ©
2026 Astronomy Image Explorer. All Rights Reserved.
