

Image Details

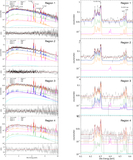
Caption: Figure 3.
XRISM/Resolve subarray counts spectra are shown together with the best-fit total 1T models, as in Figure 2, but with linear y-axes and zoomed in on the Fe-band region.
Other Images in This Article
Copyright and Terms & Conditions
© 2026. The Author(s). Published by the American Astronomical Society.

Copyright ©
2026 Astronomy Image Explorer. All Rights Reserved.
