

Image Details
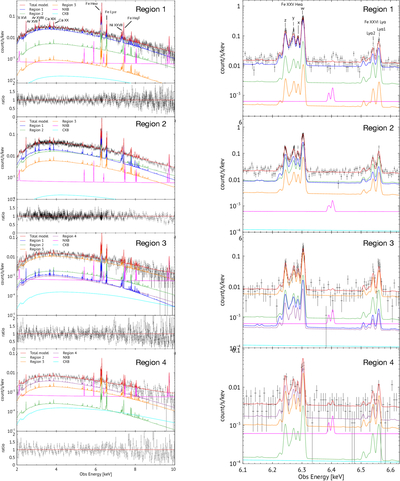
Caption: Figure 2.
Left panels: XRISM/Resolve subarray counts spectra are shown along with the best-fit 1T models after accounting for spatial–spectral mixing. In all four panels, the best-fit model components are folded through the relevant instrumental response and plotted as follows: red, blue, green, orange, purple, magenta, and cyan for the total model, region 1 (0–0﹩\mathop{.}\limits^{{\rm{^{\prime} }}}﹩75), region 2 (0﹩\mathop{.}\limits^{{\rm{^{\prime} }}}﹩75–1﹩\mathop{.}\limits^{{\rm{^{\prime} }}}﹩5), region 3 (1﹩\mathop{.}\limits^{{\rm{^{\prime} }}}﹩5–3﹩{}^{{\prime} }﹩), region 4 (3﹩{}^{{\prime} }﹩–4﹩\mathop{.}\limits^{{\rm{^{\prime} }}}﹩5), NXB, and CXB, respectively. Bottom panels in all four spectra represent ratios between data/model. Right panels: same as left but zoomed into Fe xxv-Heα and Fe xxvi-Lyα line complexes.
Other Images in This Article

Copyright and Terms & Conditions
© 2026. The Author(s). Published by the American Astronomical Society.

