Image Details
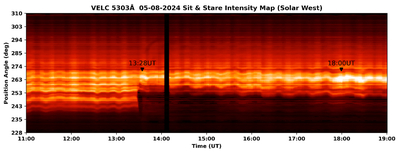
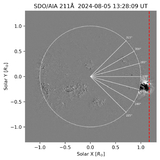
Caption: Figure 2.
Temporal variations in the peak intensities of the 5303 Å emission line from the solar corona in the solar position angle range ≈228°–310° observed on 2024 August 5 with VELC. The center of spectrograph slit 4 was positioned close to the west limb of the Sun at r = 1.17R⊙. A sudden dimming of the intensity can be clearly observed in the position angle range ≈240°–253° at ≈13:28 UT. The black vertical line near 14:00 UT is due to missing data. The oscillatory pattern in the image is due to changes in the satellite pointing.
Other Images in This Article
Copyright and Terms & Conditions
© 2026. The Author(s). Published by the American Astronomical Society.
Copyright ©
2026 Astronomy Image Explorer. All Rights Reserved.