Image Details
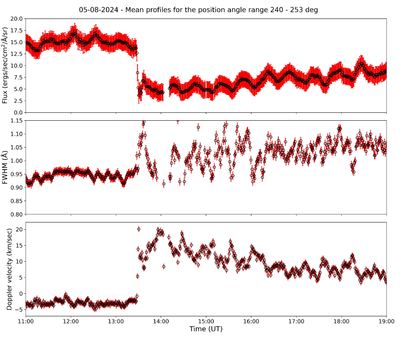
Caption: Figure 4.
The upper panel shows time variation of the VELC 5303 Å emission-line flux (Figure 2), spatially averaged in the position angle range 240°–253° along slit 4. The profiles in the middle and lower panels are the corresponding width of the emission line and Doppler velocity of the coronal plasma. The vertical extent of the “red” line on each data point indicates the magnitude of the uncertainties in the estimates.
Other Images in This Article
Copyright and Terms & Conditions
© 2026. The Author(s). Published by the American Astronomical Society.
Copyright ©
2026 Astronomy Image Explorer. All Rights Reserved.