Image Details
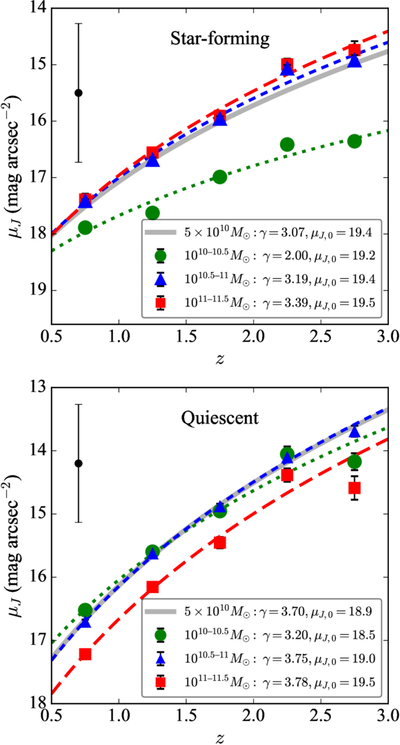
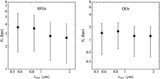
Caption: Figure 2.
Redshift evolution of intrinsic rest-frame J-band surface brightness, μJ, corrected for dust extinction and cosmological dimming. In each redshift bin, symbols denote the median μJ, shown as green circles, blue triangles, and red squares from lowest to highest mass bin. The black error bar in the upper-left corner indicates the average 1σ scatter of the distributions across the redshift bins. The error bars on the data points represent the uncertainties of the medians, which are smaller than or comparable to the symbol size. The best-fit relation from Equation (11) for each mass bin is plotted, with parameters given in the legend.
Other Images in This Article
Copyright and Terms & Conditions
© 2026. The Author(s). Published by the American Astronomical Society.