Image Details
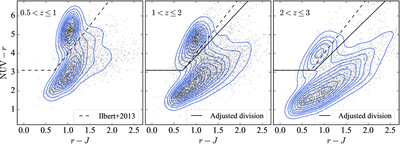
Caption: Figure 1.
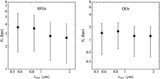
Rest-frame color–color diagram for our galaxy sample in three redshift bins. The individual measurement is marked by the background gray dot. Contours indicate regions enclosing a given fraction of galaxies within each redshift range, with levels varying by 10%. The dashed line indicates the division line between star-forming and quiescent galaxies proposed by O. Ilbert et al. (2013), while solid lines represent our adjusted division lines.
Other Images in This Article
Copyright and Terms & Conditions
© 2026. The Author(s). Published by the American Astronomical Society.
Copyright ©
2026 Astronomy Image Explorer. All Rights Reserved.