Image Details
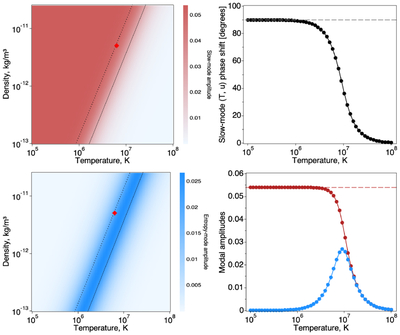
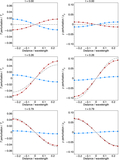
Caption: Figure 5.
Top: slow-mode temperature amplitude (left) and phase shift between temperature and velocity perturbations (right) given by Equations (16) and (17). The horizontal dashed line in the top right panel indicates the phase shift of π/2 in the ideal adiabatic regime. Bottom: entropy-mode temperature amplitude as a function of loop temperature and density given by Equation (18) (left) and that versus slow-mode temperature amplitude at fixed density ρ0 = 5 × 10⁻¹² kg m−3 (right, in blue and red, respectively). The horizontal dashed line in the bottom right panel shows the adiabatic slow-mode temperature amplitude ﹩({A}_{u0}/{c}_{{\rm{s}}})\times (\gamma -1)\times \sin (2\pi {z}_{0}/{\lambda }_{0})\approx 0.054﹩ for Au0/cs = 0.1 and z0 = 0.15λ0. The dotted and solid black lines in the left panels indicate the entropy-to-slow damping time ratio τentropy/τslow = 0.3 and 0.1, respectively (see Figure 1). The red diamond shows the combination of ρ0 = 5 × 10⁻¹² kg m−3 and T0 = 6.3 MK used in our numerical analysis (Figures 2–4).
Other Images in This Article
Copyright and Terms & Conditions
© 2026. The Author(s). Published by the American Astronomical Society.