Image Details
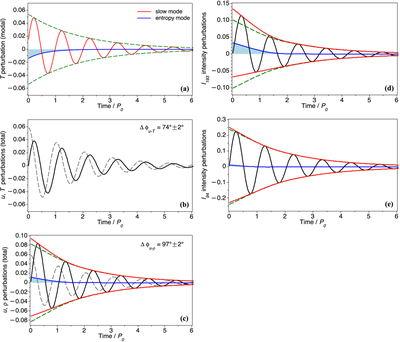
Caption: Figure 3.
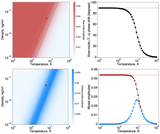
Panel (a): time evolution of the slow-mode component (red) and the entropy-mode component (blue) given by Equations (13) and (14) in the total loop temperature perturbation shown in Figure 2 (and in panel (b)). Green dashed lines show exponentially decaying slow-mode envelopes. Panel (b): total loop temperature perturbation (black solid; same as in Figure 2) and velocity perturbation (gray dashed), obtained from the numerical solution of Equations (1)–(4) at z = 0.15λ0. The blue shaded region in panel (a) highlights the amplitude mismatch between the oscillatory signals shown in panel (a) in red and panel (b) in black solid. Panel (c): total density perturbation (solid black) obtained numerically and its upper and lower envelopes (solid red) decomposed into the slow-mode component (green dashed) and the entropy-mode component (blue solid with shading). As in panel (b), the gray dashed line shows the velocity perturbation. Panel (d): intensity perturbations in the 193 Å channel of SDO/AIA, synthesized as described in Section 3.2. The total envelopes and their slow-mode and entropy-mode components are shown in red, dashed green, and blue shading, respectively. Panel (e): same as panel (d) but for the 94 Å channel.
Other Images in This Article
Copyright and Terms & Conditions
© 2026. The Author(s). Published by the American Astronomical Society.