Image Details
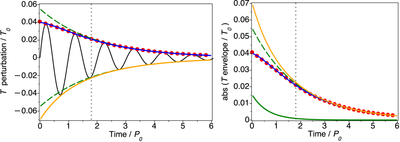
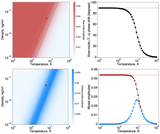
Caption: Figure 2.
Left: relative loop temperature perturbation (black), obtained from the numerical solution of Equations (1)–(4) at z0 = 0.15 (normalized to the wavelength λ0 = 2L for L = 180 Mm). The signal’s upper and lower envelopes are shown with the blue line (and red circles) and the orange line, respectively. The green dashed lines show exponential best fits of the signal’s upper and lower envelopes at t > 3τentropy. Right: temperature perturbation envelopes (blue line with red circles and orange line, both shown as absolute values), decomposed into two exponentially decaying components: the slow mode (green dashed) and the entropy mode (green solid). Accordingly, the sum and difference of the green dashed and green solid lines reproduce the orange (lower envelope) and blue (upper envelope) lines, respectively. The vertical dotted line in both panels indicates 3τentropy given by Equation (11).
Other Images in This Article
Copyright and Terms & Conditions
© 2026. The Author(s). Published by the American Astronomical Society.