Image Details
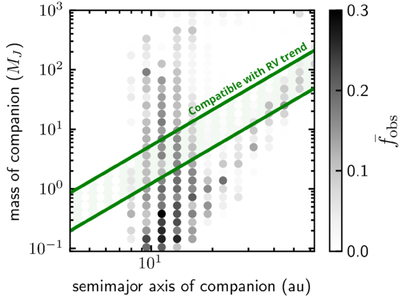
Caption: Figure 3.
Mass–semimajor axis diagram for the hypothetical intermediate companion. The points are colored according to the probability of observing TOI-1710 A b in its current configuration, as computed from our secular integrations. Each point represents an average over a range of initial mutual inclinations between the intermediate companion and the M dwarf companion. The green region indicates the 5σ constraints imposed by the observed RV trend.
Other Images in This Article
Copyright and Terms & Conditions
© 2026. The Author(s). Published by the American Astronomical Society.
Copyright ©
2026 Astronomy Image Explorer. All Rights Reserved.