Image Details
Caption: Figure 1.
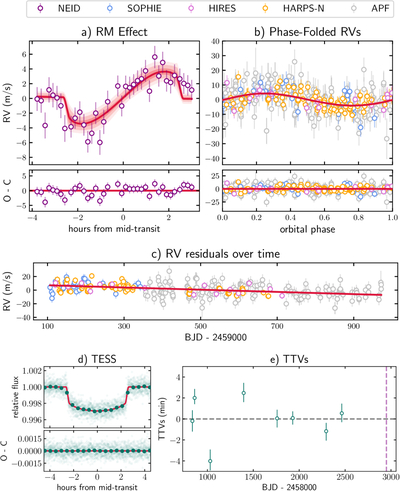
Observations of TOI-1710 A. (a) NEID RVs, after subtracting a long-term linear trend (purple) along with the best-fit model including the RM effect (red curve) and the associated confidence intervals (1σ, 2σ, and 3σ, shaded red). Residuals are shown in the bottom panel. (b) Out-of-transit RVs versus orbital phase, along with the best-fit model (the confidence intervals are too small to be seen clearly). Residuals are shown in the bottom panel. (c) RV residuals versus time, after subtracting the signal of TOI-1710 A b. The red line is a linear RV trend, which is detected with 8σ confidence. (d) Transit photometry from TESS (green) along with the best-fit model (red). The darker points are time-averaged data. Residuals are shown in the bottom panel. (e) Deviations between measured transit times and the best-fit constant period model as a function of time. The vertical dashed line indicates the transit that was observed spectroscopically with NEID.
Other Images in This Article
Copyright and Terms & Conditions
© 2026. The Author(s). Published by the American Astronomical Society.