Image Details
Caption: Figure 1.
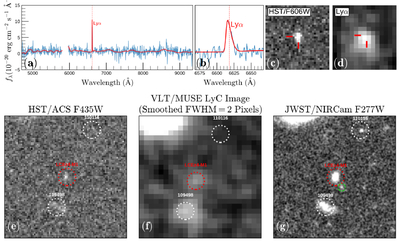
MUSE spectrum and multiband cutouts of LCEz4-M1. (a) The full MUSE spectrum. No emission lines other than Lyα are detected. (b) The Lyα emission line in the MUSE spectrum. (c) The HST ACS/WFC F606W image, whose bandpass covers the Lyα line. (d) The Lyα narrowband image extracted from the MUSE data cube. (e) The HST ACS/WFC F435W cutout tracing the LyC emission. (f) The VLT/MUSE LyC narrowband image, smoothed with an FWHM of 2 pixels for display. (g) The JWST/NIRCam F277W cutout, probing the rest-frame optical continuum and the [O III] emission line. In panels (c) and (d), the size of each cutout is 2″ × 2″, and is 5″ × 5″ in panels (e)–(g). The red dotted circles (r = 0﹩\mathop{.}\limits^{\unicode{x02033}}﹩35) mark LCEz4-M1, the white dotted circles (r = 0﹩\mathop{.}\limits^{\unicode{x02033}}﹩35) mark nearby foreground sources, and the small green circle (r = 0﹩\mathop{.}\limits^{\unicode{x02033}}﹩15) in panel (g) marks the companion candidate.
Other Images in This Article
Copyright and Terms & Conditions
© 2026. The Author(s). Published by the American Astronomical Society.