Image Details
Caption: Figure 2.
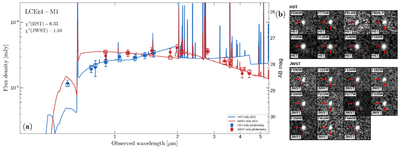
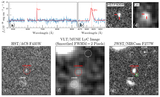
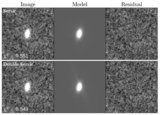
SED fitting and HST/JWST cutouts of LCEz4-M1. (a) Comparison between the SED fits obtained using the HST-only and JWST-only photometry. Filled symbols show the observed photometry, open squares show the model-predicted fluxes, and the blue and red curves show the best-fit HST-only and JWST-only model spectra, respectively. The displayed fit statistics are χ2(HST) = 0.33 and χ2(JWST) = 1.10. (b) HST and JWST cutouts centered on LCEz4-M1. The red ticks mark the source position. The size of each cutout is 2″ × 2″.
Other Images in This Article
Copyright and Terms & Conditions
© 2026. The Author(s). Published by the American Astronomical Society.
Copyright ©
2026 Astronomy Image Explorer. All Rights Reserved.