Image Details
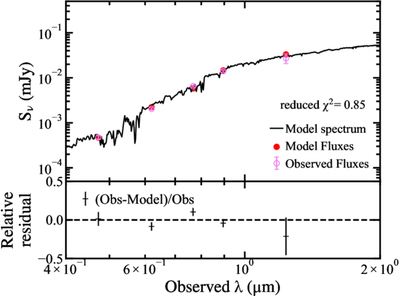
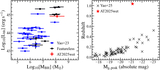
Caption: Figure 5.
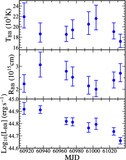
The host SED fitting results using the package CIGALE. Top panel: the different components considered in the SED fitting. The red points represent the model flux for each band derived from the best-fit SED, and the violet circles indicate the observed data. Bottom panel: the residuals between the observed data and model flux.
Other Images in This Article
Copyright and Terms & Conditions
© 2026. The Author(s). Published by the American Astronomical Society.
Copyright ©
2026 Astronomy Image Explorer. All Rights Reserved.