Image Details
Caption: Figure 1.
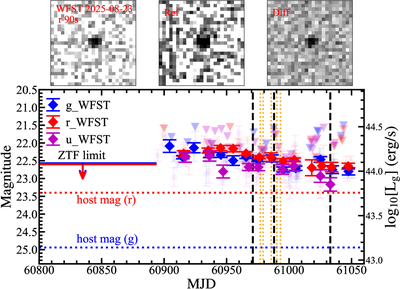
Top left: WFST r-band image, which was taken on 2025 August 23 UT. Top middle: WFST r-band stack reference image of the host galaxy. Top right: difference image of AT2025wet. Bottom: multiwavelength light curves of AT2025wet showing a slow decline with blue color in the optical bands (∼100 days). The 10 day binned measurements are shown as diamond symbols, overlaid on the individual measurements shown as semitransparent circles. The black vertical lines marks the dates of our spectral observations and the triangles represent upper limits. The orange vertical dotted line marks the date of our Neil Gehrels Swift Observatory (Swift) observation. The 6 month stacked ZTF detection limits are indicated by horizontal lines, while the host-galaxy magnitudes are shown with dashed lines. The photometry shown in the figure is available in machine-readable format as the data behind the figure.
(The data used to create this figure are available in the online article.)
(The data used to create this figure are available.)
Other Images in This Article
Copyright and Terms & Conditions
© 2026. The Author(s). Published by the American Astronomical Society.