Image Details
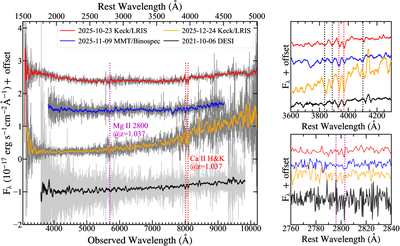
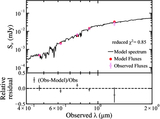
Caption: Figure 2.
Left panel: optical spectra of AT2025wet. Each spectrum is labeled by the instrument employed and the date of observation. Smoothed spectra obtained with a Savitzky–Golay filter are shown, with the original, unsmoothed data plotted in gray behind. Ca II h and k and Mg II λ2800 absorption lines corresponding to the host-galaxy redshift of z = 1.037 are marked in the figure. The spectra shown in this figure are available in machine-readable format as data behind the figure. Right panels: zoom-in views of the spectral regions around the Ca II h and k (red) and Balmer (black) lines in the top panel and the Mg II λλ2796, 2803 lines (magenta) in the bottom panel. To better display the narrow Mg II lines, we show the unsmoothed spectra in the bottom panel.
(The data used to create this figure are available in the online article.)
(The data used to create this figure are available.)
Other Images in This Article
Copyright and Terms & Conditions
© 2026. The Author(s). Published by the American Astronomical Society.