

Image Details
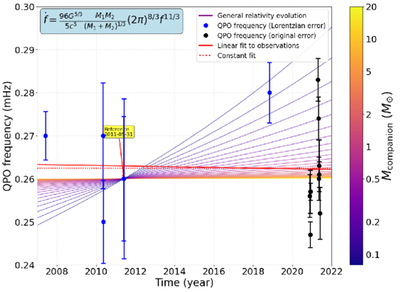
Caption: Figure 6.
Evolution of QPO frequency as a function of time. The blue points represent QPO frequencies from 2007 to 2018, with data taken from C. Jin et al. (2020); 1σ error bars are derived from the QPO central frequency and quality factor using the Lorentzian FWHM relation σf = fQPO/(2Q). The black points represent QPO frequencies and 1σ error bars from 2020 to 2021, with data taken from R. Xia et al. (2024). The colored lines show the expected evolution of an extreme-mass-ratio companion considering only general relativity, assuming circular orbits (eccentricity e = 0) and companion masses ranging from 0.01 M⊙ to 20 M⊙. The color bar indicates the mass distribution. The matching point for the general relativity model is chosen as the QPO frequency on 2011 May 31. The red solid line is a linear fit to the frequency evolution; the negligible slope indicates no systematic evolution trend, with frequency variations dominated by oscillations.
Other Images in This Article
Show More
Copyright and Terms & Conditions
© 2026. The Author(s). Published by the American Astronomical Society.

