

Image Details
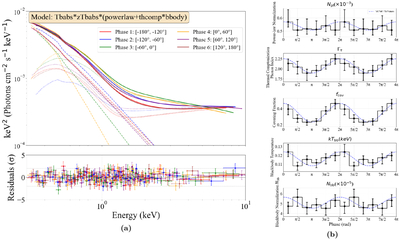
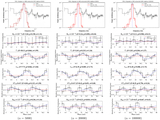
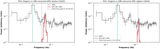
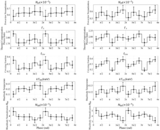
Caption: Figure 2.
(a) Joint-fitted eeufspec spectra and residuals for Obs2 across six phase intervals. The dashed lines represent model components, the solid lines represent fitting curves, and the different colors represent results at different phases. (b) Modulation of spectral parameters with QPO phase for Obs2. The black points represent best-fit spectral parameter values using the tbabs*ztbabs*(powerlaw+thcomp*bbody) model in different phase intervals, the error bars represent 1σ uncertainties, and the blue dashed lines represent sinusoidal function curves fitted to the QPO phase-folded light curve and normalized in different spectral parameter plots (taking the maximum spectral parameter fit value as the peak and the minimum spectral parameter fit value as the trough).
Other Images in This Article
Show More
Copyright and Terms & Conditions
© 2026. The Author(s). Published by the American Astronomical Society.

