

Image Details
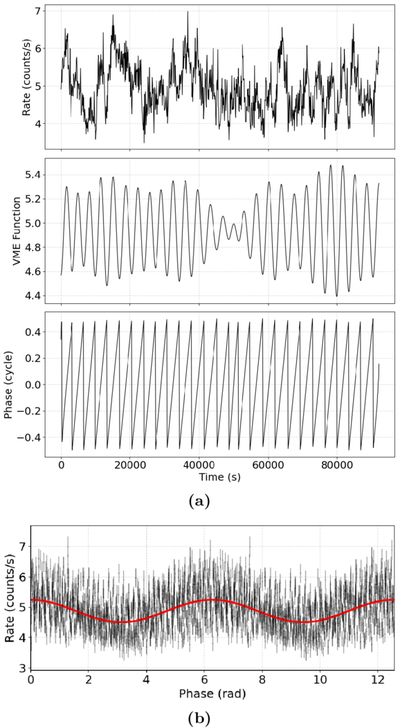
Caption: Figure 1.
(a) HHT analysis of Obs5, showing from top to bottom the net light curve in the 0.3–10 keV energy band, the QPO intrinsic mode function, and the corresponding instantaneous phase. (b) Phase-folded light curve of Obs5 in the 0.3–10 keV energy band, where the black points represent unbinned data with error bars and the red solid line represents the best-fit sinusoidal function.
Other Images in This Article
Show More
Copyright and Terms & Conditions
© 2026. The Author(s). Published by the American Astronomical Society.

Copyright ©
2026 Astronomy Image Explorer. All Rights Reserved.
