Image Details
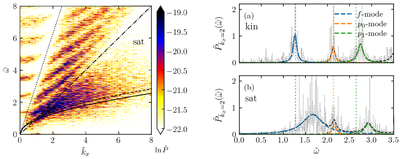
Caption: Figure 4.
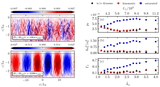
Left: same as Figure 2 but for the magnetic run d1. A noticeable broadening of the f-mode is seen with increasing ﹩{\tilde{k}}_{x}﹩. Right: line profiles of the f-, p0-, and p1-mode at ﹩{\tilde{k}}_{x}=2﹩ for the kinematic phase (a) and for the saturated phase (b); dotted curves represent the data. To ensure a consistent comparison, the background has been removed. Blue dashed lines show the locations of the f-mode.
Other Images in This Article
Copyright and Terms & Conditions
© 2026. The Author(s). Published by the American Astronomical Society.
Copyright ©
2026 Astronomy Image Explorer. All Rights Reserved.