Image Details
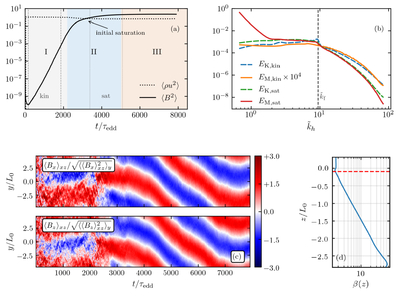
Caption: Figure 3.
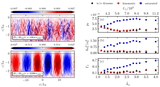
(a) Time evolution of the kinetic and magnetic energies for run d1. Three phases, (I) kinematic, (II) weak nonlinear, and (III) saturated, of the α2 dynamo are highlighted. (b) Kinetic and magnetic energy spectra are shown from the plane at z = −0.1L0, during the kinematic and saturated phases. The black dashed line shows the forcing wavenumber kf. (c) Spacetime diagram of the mean magnetic field components. Magnetic fields are first averaged over the x–z plane to define ﹩{\langle {B}_{x}\rangle }_{xz}﹩ and ﹩{\langle {B}_{z}\rangle }_{xz}﹩. These quantities are then normalized by their corresponding rms values ﹩\sqrt{{\langle {\langle {B}_{x}\rangle }_{xz}^{2}\rangle }_{y}}﹩ and ﹩\sqrt{{\langle {\langle {B}_{z}\rangle }_{xz}^{2}\rangle }_{y}}﹩, respectively. (d) Vertical profile of horizontally averaged plasma beta β(z), in the saturated phase. The red dashed line marks z = −0.1L0.
Other Images in This Article
Copyright and Terms & Conditions
© 2026. The Author(s). Published by the American Astronomical Society.