Image Details
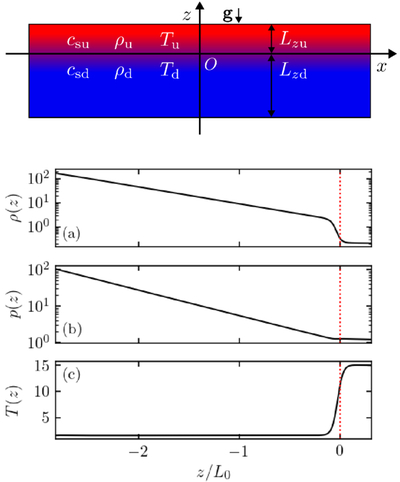
Caption: Figure 1.
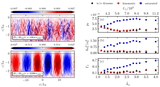
Top: schematic of the two-layer simulation domain. Bottom: equilibrium profiles of (a) density, (b) pressure, and (c) temperature as a function of z for Lz/L0 = π. The red dotted line marks the interface at z = 0.
Other Images in This Article
Copyright and Terms & Conditions
© 2026. The Author(s). Published by the American Astronomical Society.
Copyright ©
2026 Astronomy Image Explorer. All Rights Reserved.