

Image Details
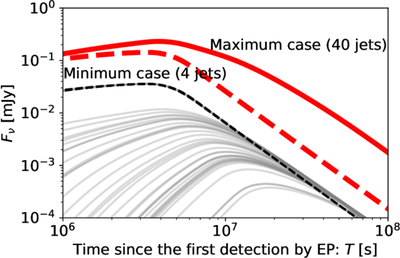
Caption: Figure 3.
Predicted radio (1.3 GHz) afterglow light curves for the maximum (40 jets; red solid line) and minimum (four jets; red dashed line) cases. The gray solid lines show the emission from individual jets in the maximum case, while the black dashed lines represent the emission from individual jets in the minimum case. At T ∼ 108 s, the maximum case is approximately an order of magnitude brighter than the minimum case.
Other Images in This Article
Copyright and Terms & Conditions
© 2026. The Author(s). Published by the American Astronomical Society.

Copyright ©
2026 Astronomy Image Explorer. All Rights Reserved.
