

Image Details
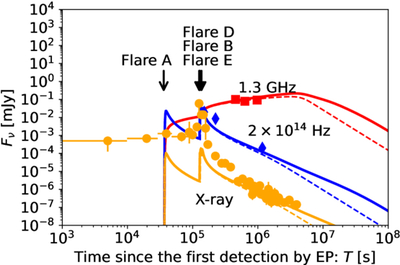
Caption: Figure 2.
Afterglow light curves in the X-ray (5 keV; orange), near-infrared (2 × 10¹⁴ Hz; blue), and radio (1.3 GHz; red) bands, compared with the observed data of GRB 250702B (X-ray: orange circles; near-infrared: blue diamonds; radio: red squares). The thick solid and thin dashed lines denote the predicted emission for the maximum (40 jets) and minimum (four jets) cases, respectively. Black arrows indicate the times of the observed gamma-ray flares.
Other Images in This Article
Copyright and Terms & Conditions
© 2026. The Author(s). Published by the American Astronomical Society.

Copyright ©
2026 Astronomy Image Explorer. All Rights Reserved.
