Image Details
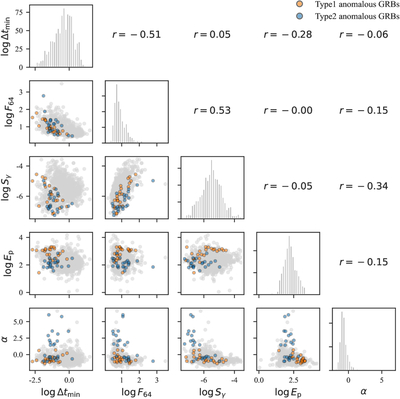
Caption: Figure 3.
Corner plot of the five parameters used in the t-SNE analysis: ﹩\mathrm{log}{\rm{\Delta }}{t}_{{\rm{\min }}}﹩, ﹩\mathrm{log}{F}_{64}﹩, ﹩\mathrm{log}{S}_{\gamma }﹩, ﹩\mathrm{log}{E}_{{\rm{p}}}﹩, and α. The lower triangle shows the pairwise distributions of the GRB sample, while the upper triangle presents the corresponding Pearson correlation coefficients. Gray points represent GRBs whose machine-learning classification is consistent with the traditional duration-based classification. Colored points mark anomalous bursts for which the machine-learning classification disagrees with the conventional T90 criterion.
Other Images in This Article
Copyright and Terms & Conditions
© 2026. The Author(s). Published by the American Astronomical Society.