Image Details
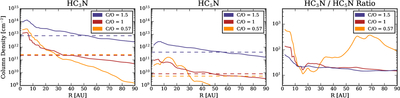
Caption: Figure 3.
Comparison of HC3N (left panel) and HC5N (middle panel) column densities from chemical models assuming different C/O ratios, with dashed lines indicating disk-averaged column densities, and the HC3N/HC5N ratio (right panel) for each C/O ratio.
Other Images in This Article
Copyright and Terms & Conditions
© 2026. The Author(s). Published by the American Astronomical Society.
Copyright ©
2026 Astronomy Image Explorer. All Rights Reserved.