Image Details
Caption: Figure 2.
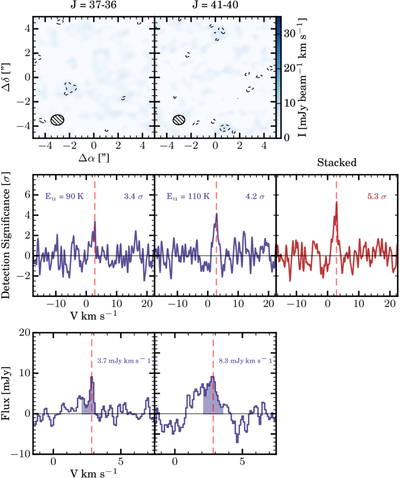
HC5N emission detected using multiple analysis techniques. Top panels: moment-0 maps of both observed HC5N transitions. Center panels: matched filtering impulse response spectra of the individual transitions with detection significance labeled (blue), along with the stacked combined spectrum (red). Bottom panels: shifted and stacked image plane spectra for each transition, together with the flux integrated between 2.0 and 3.7 km s−1.
Other Images in This Article
Copyright and Terms & Conditions
© 2026. The Author(s). Published by the American Astronomical Society.
Copyright ©
2026 Astronomy Image Explorer. All Rights Reserved.