Image Details
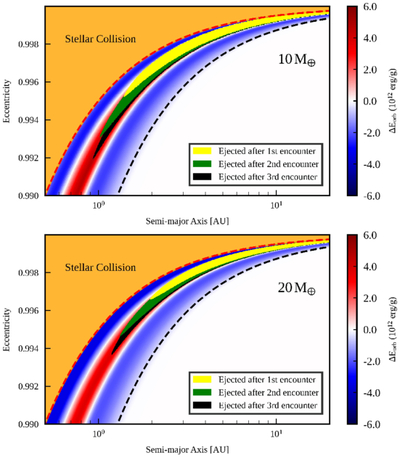
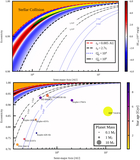
Caption: Figure 4.
Predicted orbital energy change in the a–e parameter space; rp increases from the top-left to the bottom-right corner. The panels map the cumulative specific orbital energy change, ΣΔEorb, after three tidal encounters as a function of the initial orbital semimajor axis a and eccentricity e, for planetary models with a 10 M⊕ (upper panel) and a 20 M⊕ (lower panel) core. The color indicates the net energy change (red: increase; blue: decrease). The yellow, green, and black shaded regions mark orbits that would be ejected after one, two, and three encounters, respectively. The red dashed line denotes the stellar collision boundary (rp = 0.005 au). The black dashed line at rp/rt = 2.7 indicates the critical disruption zone identified in previous coreless models.
Other Images in This Article
Copyright and Terms & Conditions
© 2026. The Author(s). Published by the American Astronomical Society.