Image Details
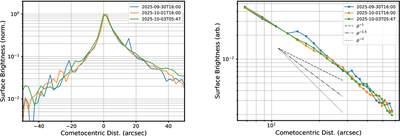
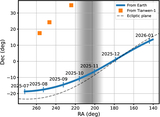
Caption: Figure 4.
(Left) Surface brightness scan of the coma along the Sunward–antisunward direction, normalized to the peak brightness. Left is the sunward direction, and right is the antisunward direction. The profile is averaged over a ∼10″ wide strip. An obvious asymmetry is shown between the sunward (left) and antisunward (right) direction, consistent with the effect of SRP. (Right) Azimuthally averaged surface brightness profile with respect to cometocentric distance, derived from the photometry measured in a series of concentric annulus apertures centered on the centroid of the comet. Also shown are the lines representing exponential slopes of −1 and −2.
Other Images in This Article
Copyright and Terms & Conditions
© 2026. The Author(s). Published by the American Astronomical Society.