Image Details
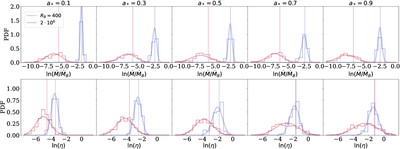
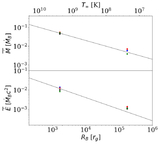
Caption: Figure 3.
Distributions of ﹩\mathrm{ln}(\dot{M}/{\dot{M}}_{{\rm{B}}})﹩ (top row) and ﹩\mathrm{ln}(\eta )﹩ (bottom row). Each column is for a given BH spin a* and the blue and red curves are for the smallest and largest Bondi radii, RB ≈ 400 rg and ≈2 × 10⁶ rg, respectively. Lognormal curves corresponding to each run are overplotted for comparison. The means of the lognormal variable X, calculated using Equation (D1) from log-space quantities ﹩{\mu }_{\mathrm{ln}X}﹩ and ﹩{\sigma }_{\mathrm{ln}X}﹩, are shown as vertical lines.
Other Images in This Article
Copyright and Terms & Conditions
© 2026. The Author(s). Published by the American Astronomical Society.
Copyright ©
2026 Astronomy Image Explorer. All Rights Reserved.