Image Details
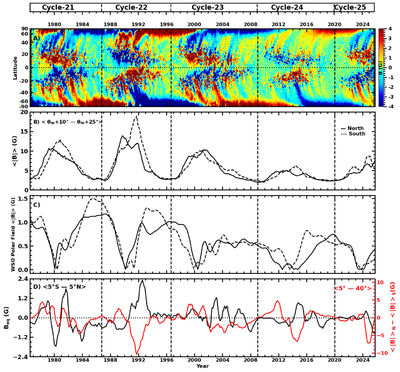
Caption: Figure 3.
Panel (A) shows the temporal and latitudinal evolution of the longitudinally averaged signed magnetic field from solar cycle 21 to the early phase of cycle 25, based on NSO Kitt Peak, SOLIS, and HMI synoptic magnetograms. Panel (B) shows the unsigned magnetic field (∣B∣) averaged over 10°–25° away from the mean latitude, θm, of peak magnetic flux in each hemisphere, while panel (C) shows the unsigned polar field from WSO measurements. In panel (D), the black solid curve is the north–south average of signed magnetic field intensity within 5°S-5°N (left y-axis), Beq, that represents the cross-equatorial flux plumes, while the red curve is the hemispheric asymmetry of active-region magnetic field, Basym, calculated as the difference between the absolute magnetic field averaged over active latitudes (5∘–40∘) in the north and south.
Other Images in This Article
Copyright and Terms & Conditions
© 2026. The Author(s). Published by the American Astronomical Society.