Image Details
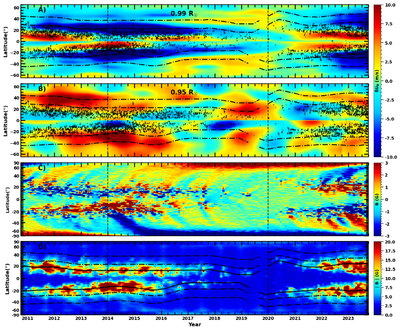
Caption: Figure 1.
Time–latitude profile of variations in the residual meridional flow at two depths, 0.99R⊙ and 0.95R⊙, respectively, are in panels (A) and (B). Positive values correspond to poleward flow in both hemispheres. Corresponding time–latitude variations in the longitudinally averaged signed (i.e., the magnetic butterfly diagram) and unsigned magnetic field are in the lower panels (C) and (D), respectively. The solid line overplotted in panel (D) marks the mean latitude, θm, of peak magnetic flux in each hemisphere, and the dotted–dashed lines in panels (A), (B), and (D) enclose the region 10°– 25° away from θm. The two vertical dotted lines mark epochs of solar cycle 24 maximum (2014) and minimum (2020). Sunspot locations are overplotted as black dots.
Other Images in This Article
Copyright and Terms & Conditions
© 2026. The Author(s). Published by the American Astronomical Society.