Image Details
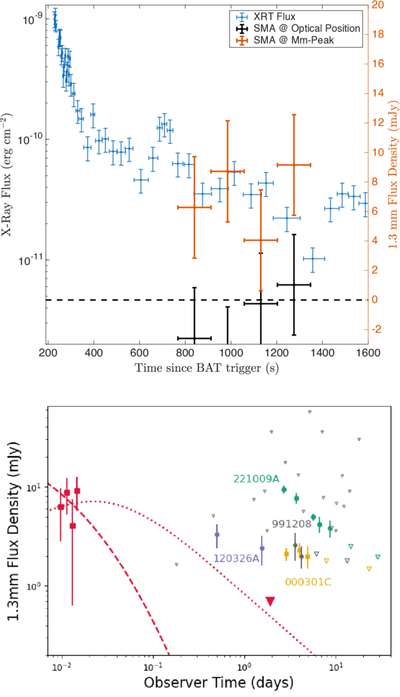
Caption: Figure 3.
Top: light-curve data of GRB 260127A as measured by Swift XRT (blue; P. A. Evans et al. 2007, 2009), and by SMA at both the optical afterglow position (black) and the mm-bright position (orange). Bottom: SMA 225 GHz observations of GRB 260127A (red points) along with fiducial RS (dashed) and FS (dotted) models, compared with a sample of (235 ± 50) GHz light curves, with detections (colored points) highlighted (from E. Berger et al. 2000; T. J. Galama et al. 2000; A. de Ugarte Postigo et al. 2012; T. Laskar et al. 2015, 2023; J. S. Bright et al. 2023). Triangles indicate upper limits.
Other Images in This Article
Copyright and Terms & Conditions
© 2026. The Author(s). Published by the American Astronomical Society.
Copyright ©
2026 Astronomy Image Explorer. All Rights Reserved.