Image Details
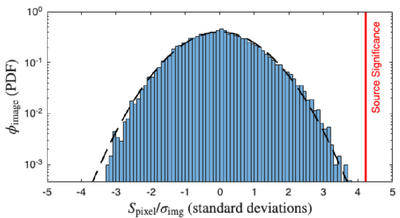
Caption: Figure 2.
A histogram of the pixel fluxes (Spixel) from imaging the January 27 data after subtraction of the fitted point-source model from the visibilities. The total area imaged in this analysis is approximately 3× the area of the primary beam (i.e., measuring 81″ on a side). The distribution of pixel fluxes is in good agreement with theoretical expectations for Gaussian noise (black dashed line), with the source significance (red line) modestly separated from the distribution of noise-like values in the image.
Other Images in This Article
Copyright and Terms & Conditions
© 2026. The Author(s). Published by the American Astronomical Society.
Copyright ©
2026 Astronomy Image Explorer. All Rights Reserved.