Image Details
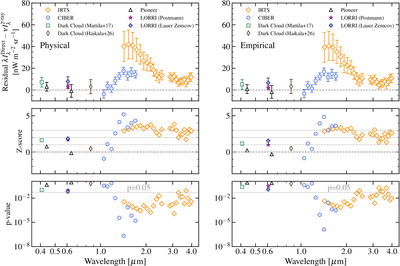
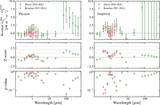
Caption: Figure 5.
Residual comparison between direct measurements of the EBL and γ-ray reconstructions. The left column shows results for the empirical reconstruction, and the right column shows the physical forward model. Panels display, from top to bottom, the residual ﹩{R}_{i}=\nu {I}_{\nu ,i}^{{\rm{IGL}}}-\nu {I}_{\nu ,i}^{\gamma -{\rm{ray}}}﹩, the corresponding Z-score, and the two-sided p-value as a function of wavelength. Markers indicate data from different instruments: IRTS (orange diamonds; T. Matsumoto et al. 2015), CIBER (blue circles; S. Matsuura et al. 2017), Pioneer 10/11 (black triangles; Y. Matsuoka et al. 2011), New Horizons LORRI (purple stars; M. Postman et al. 2024, navy plus signs with Zemcov ZL subtraction; T. R. Lauer et al. 2021), and the dark cloud method (green squares; K. Mattila et al. 2017 and brown diamonds; L. K. Haikala et al. 2026). The horizontal dotted gray line in the bottom panel represents p = 0.05.
Other Images in This Article
Copyright and Terms & Conditions
© 2026. The Author(s). Published by the American Astronomical Society.