Image Details
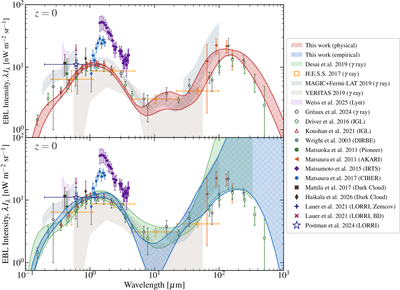
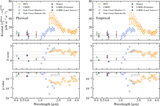
Caption: Figure 3.
Spectral energy distribution of the EBL at z = 0. Top panel: reconstruction from our physically motivated EBL model (red shaded region denoting the 68% confidence interval). Bottom panel: empirical reconstruction (blue shaded region), shown together with the result of A. Desai et al. (2019, green band). In both panels, γ-ray-based constraints from H.E.S.S. (H. E. S. S. Collaboration et al. 2017), MAGIC+Fermi-LAT (V. A. Acciari et al. 2019), and VERITAS (A. U. Abeysekara et al. 2019) are shown for comparison, together with the individual estimates from L. Gréaux et al. (2024b). IGL measurements from S. P. Driver et al. (2016) and S. Koushan et al. (2021) are also included, as well as direct measurements and upper limits from Pioneer (Y. Matsuoka et al. 2011), DIRBE (E. L. Wright 2001), AKARI (S. Matsuura et al. 2011), IRTS (T. Matsumoto et al. 2015), CIBER (S. Matsuura et al. 2017), LORRI (T. R. Lauer et al. 2021; M. Postman et al. 2024), Lyα forest constraints (L. H. Weiss et al. 2025), and the dark cloud method (L. K. Haikala et al. 2026), as indicated in the legend.
Other Images in This Article
Copyright and Terms & Conditions
© 2026. The Author(s). Published by the American Astronomical Society.