Image Details
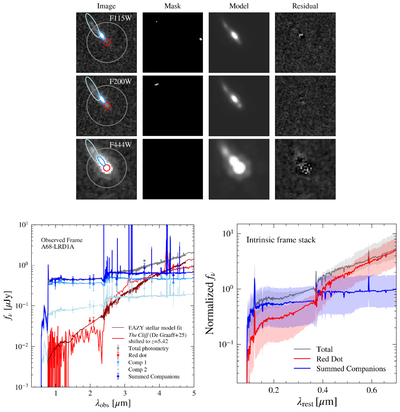
Caption: Figure 3.
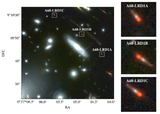
Top: JWST/NIRCam cutouts in three filters (F115W, F200W, F444W), the corresponding segmentation mask, the best-fit GALFIT model, and the residual image for A68-LRD1A. Ellipses indicate the fitted component parameters from F200W, overlaid on all bands. The gray circle shows the 0﹩\mathop{.}\limits^{\unicode{x02033}}﹩5 photometric aperture. Bottom left: SED decomposition for A68-LRD1A. Gray points show the observed total aperture photometry, while the red and blue points show the forced photometry obtained from the GALFIT fits shown in the top panel, adopting the same color scheme. Solid curves show the best-fit EAZY templates. These SEDs are shown in the observed frame, meaning that they include lensing magnification and intergalactic medium absorption. Overplotted is The Cliff spectrum from A. de Graaff et al. (2025c), only corrected for the redshift difference (without any renormalization), showing remarkable resemblance to the SED shape and intrinsic luminosity. Bottom right: stacked intrinsic rest-frame SEDs for all LRDs with companions. For each system, the total SED (gray) is normalized to the total flux density at a rest-frame wavelength of 0.3645 μm (Balmer break). The red and blue component SEDs are shown relative to this normalization. Shaded regions indicate object-to-object scatter (16th–84th percentile). For systems with multiple companions, the blue curve represents the sum of all companions.
Other Images in This Article
Copyright and Terms & Conditions
© 2026. The Author(s). Published by the American Astronomical Society.