Image Details
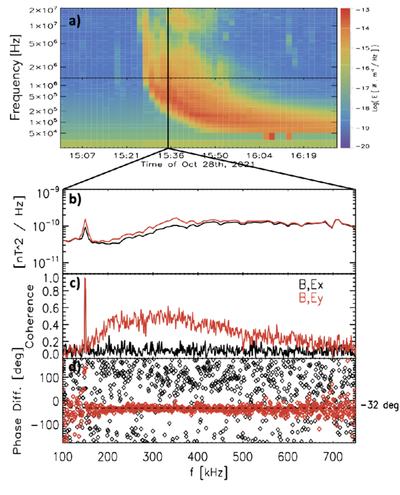
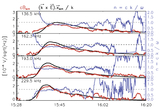
Caption: Figure 3.
PSP observations. Panel (a) shows the radio flux computed from electric field measurements performed by the High Frequency Receiver (HFR) and Low Frequency Receiver (LFR) of the FIELDS experiment. Panel (b) shows the magnetic field spectrum (red) computed from the waveform measured at 15:35:30, compared with a background spectrum (black) computed from waveforms outside the burst. Panel (c) shows the coherence between the magnetic and (x, y)-components of the electric field, and panel (d) shows the phase difference between the magnetic and electric fields.
Other Images in This Article
Copyright and Terms & Conditions
© 2026. The Author(s). Published by the American Astronomical Society.
Copyright ©
2026 Astronomy Image Explorer. All Rights Reserved.