Image Details
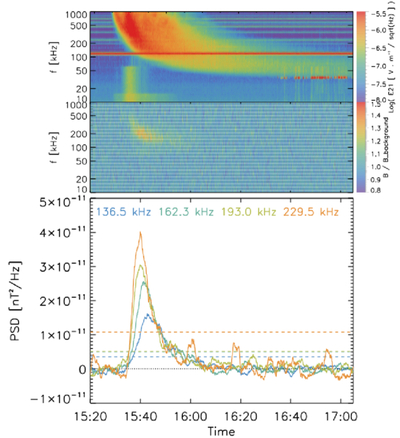
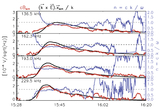
Caption: Figure 2.
Spectrograms (top) of the E21 electric field and normalized magnetic field obtained from RPW/TNR measurements and (bottom) background-subtracted time series of magnetic field power spectral density (PSD) at four frequencies. Dashed lines represent the 5σ level of the background variations over the same time period.
Other Images in This Article
Copyright and Terms & Conditions
© 2026. The Author(s). Published by the American Astronomical Society.
Copyright ©
2026 Astronomy Image Explorer. All Rights Reserved.