Image Details
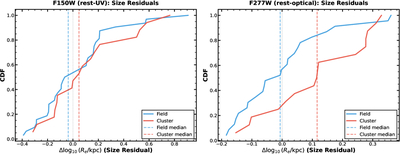
Caption: Figure 3.
Cumulative distribution functions (CDFs) of size residuals ﹩{\rm{\Delta }}{\mathrm{log}}_{10}({R}_{e})﹩ from the field size–mass relation for rest-frame UV (F150W, left) and rest-frame optical (F277W, right). Residuals are calculated as the observed size minus the size predicted from the linear relation fit to our field LAE sample (Section 4.2) at each galaxy’s stellar mass. Blue lines show field LAEs (centered near zero by construction), and red lines show protocluster LAEs. In rest-UV (left panel), the distributions are statistically indistinguishable (KS p = 0.79; Mann–Whitney p = 0.42). In rest-optical (right panel), protocluster LAEs show positive residuals (median ﹩{\rm{\Delta }}{\mathrm{log}}_{10}({R}_{e})=+0.1{2}_{-0.04}^{+0.07}﹩ dex; Mann–Whitney p = 0.033, 2.1σ; KS p = 0.029), indicating they are ≃31% larger than field galaxies of comparable stellar mass.
Other Images in This Article
Copyright and Terms & Conditions
© 2026. The Author(s). Published by the American Astronomical Society.